vue2中vue-echarts的使用
...小于 1 分钟
vue2中vue-echarts的使用
首先通过npm安装echarts和vue-echarts
npm i echarts vue-echarts
main.js全局引入注册
import 'echarts'
import ECharts from 'vue-echarts'

Vue.component('v-chart', ECharts)
vue页面使用
设置好option即可显示,option的设置文档,vue-charts文档
<template>
    <div>
        <v-chart class="chart" :option="option" />
    </div>
</template>

<script>
export default {
    data() {
        return {
            option: {
                xAxis: {
                    type: 'category',
                    data: ['Mon', 'Tue', 'Wed', 'Thu', 'Fri', 'Sat', 'Sun']
                },
                yAxis: {
                    type: 'value'
                },
                series: [
                    {
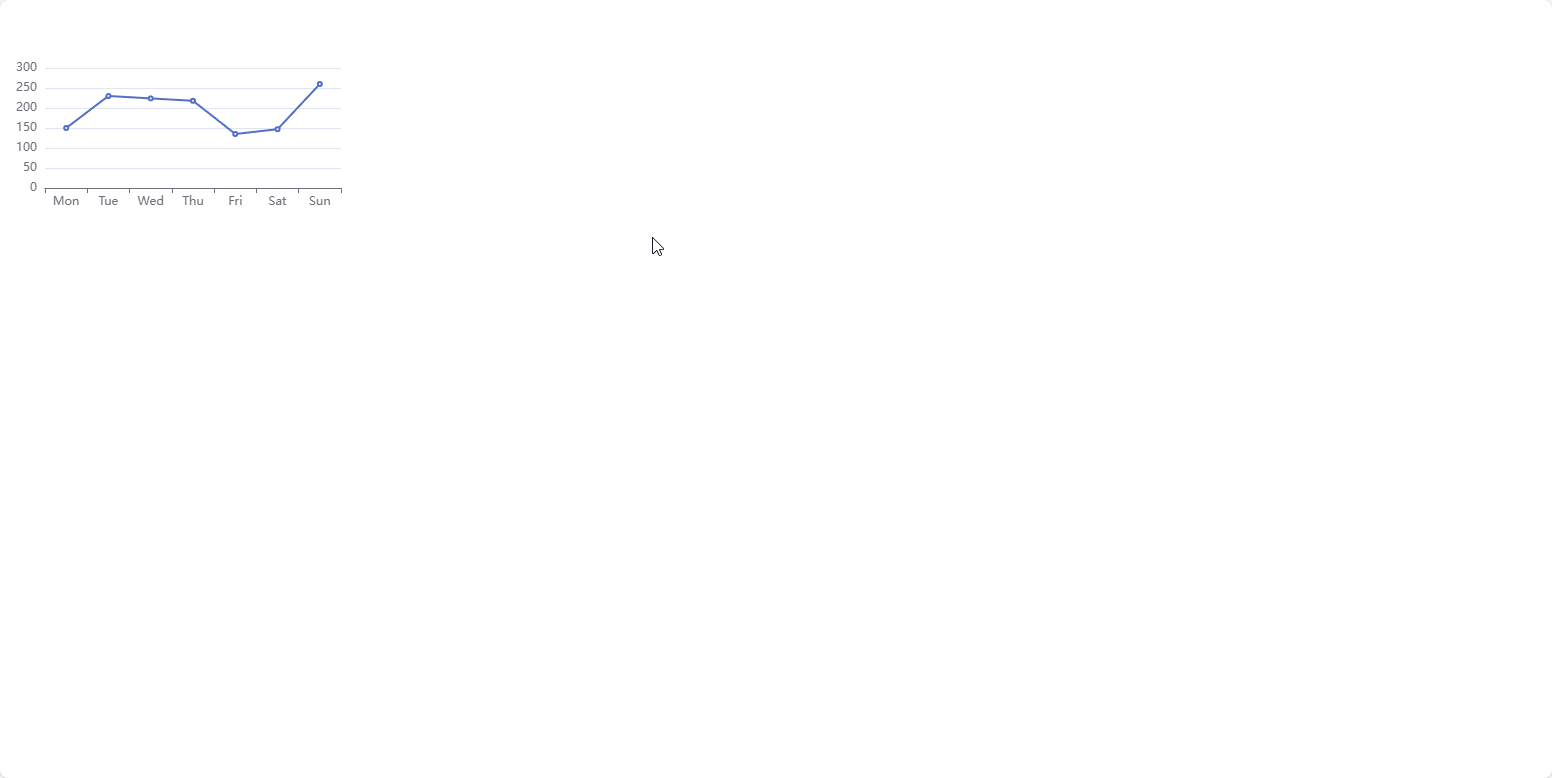
                        data: [150, 230, 224, 218, 135, 147, 260],
                        type: 'line'
                    }
                ]
            }
        }
    },
    methods: {

    }
}

</script>

<style scoped>
.chart {
    height: 250px;
    width: 370px;
}
</style>
最好设置v-chart组件的宽高,否则页面不会显示且出现以下警告
[ECharts] Can't get DOM width or height. Please check dom.clientWidth and dom.clientHeight. They should not be 0.For example, you may need to call this in the callback of window.onload.
效果图:


